


A bottom-up business case for forecast accuracy, planner productivity, network optimization, and disruption avoidance — and the number it adds up to.
The ROI of an AI supply chain program is the annual run-rate value it returns against a company's cost of goods sold (COGS), measured across four operational levers: forecast accuracy and inventory, planner and analyst productivity, transportation and network optimization, and disruption avoidance. For most enterprise CPG and FMCG operators, the honest answer sits in a band — not a single hero number — and that band is what determines whether a program is worth funding.
Here is the short version. For a typical $10 billion revenue CPG company with roughly $6 billion in COGS, a well-scoped AI program across those four levers lands at an estimated $125–260 million in annual run-rate value, or about 2–5% of COGS, with payback in 9–18 months. The range is wide because the value is real but conditional: it depends on scope, data quality, and whether the program is structured around operational outcomes rather than software seats. Most of the gap between the low and high end of that band is execution, not technology.
What the four value levers actually contribute
The total breaks down into four levers, each tied to a documented operational mechanism rather than a vendor promise. The single largest contributor is forecast accuracy and inventory, because it compounds across working capital, service levels, and waste at the same time.
The component math is grounded in published benchmarks. McKinsey research finds that AI-driven forecasting can reduce supply chain errors by 20–50%, cut inventory by 20–30%, and lower lost sales and product unavailability by as much as 65%, while trimming warehousing costs by 5–10% and administration costs by 25–40% (McKinsey, Harnessing the power of AI in distribution operations). Applied to a $6 billion COGS base, even the conservative end of those ranges produces a forecast-and-inventory lever worth $60–120 million on its own.
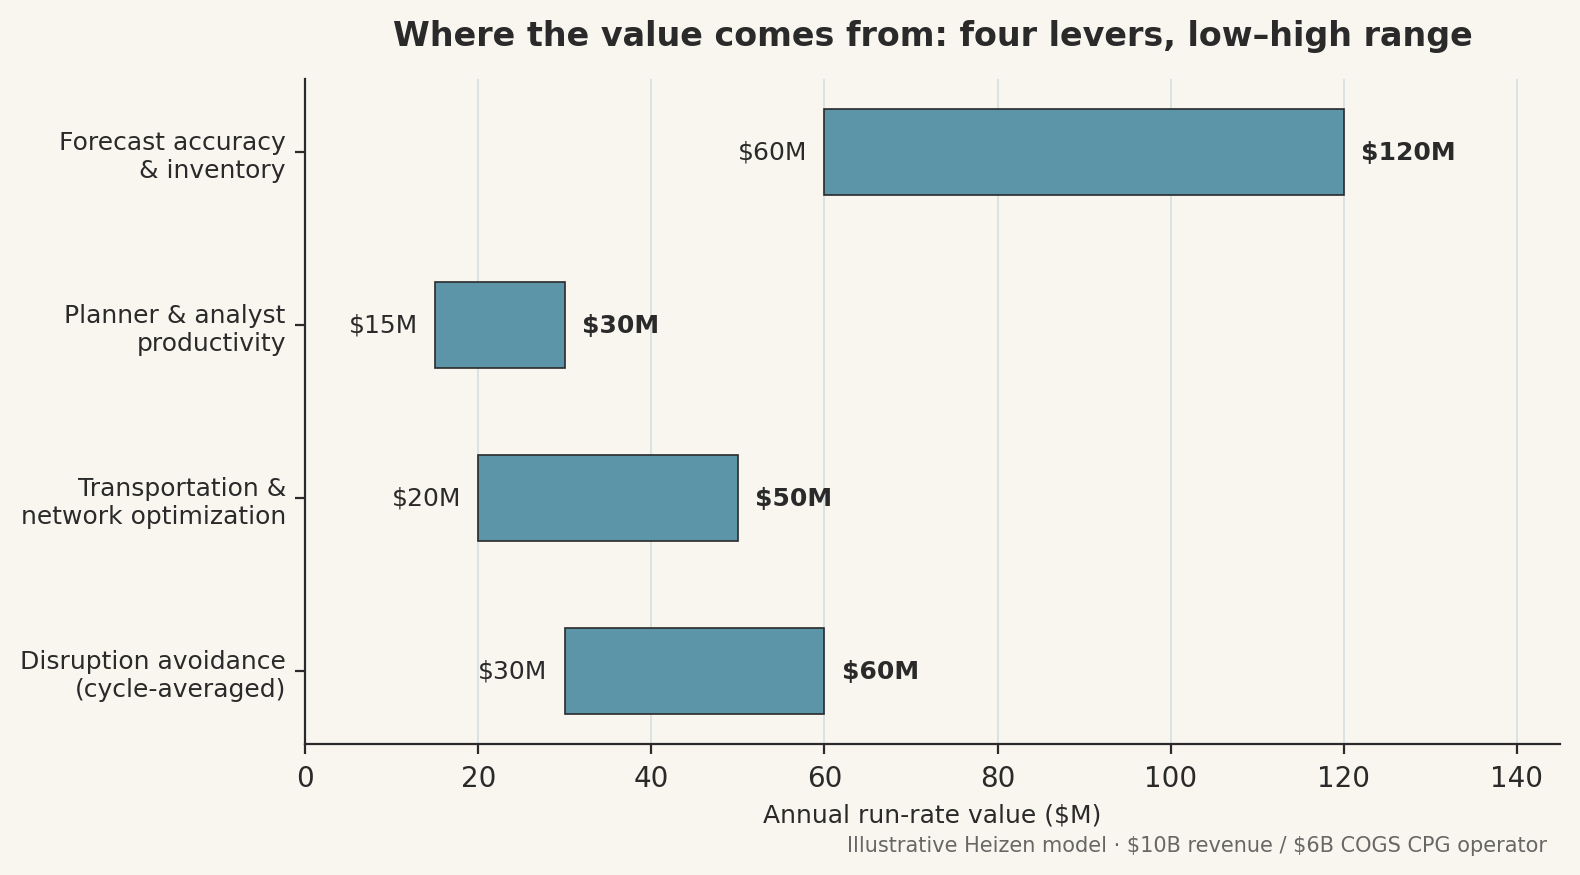
Here is how the full business case stacks up for the illustrative operator:
This table is an illustrative Heizen model. The component ranges are anchored in public benchmarks (cited throughout); the aggregate is a synthesis, not a single published figure. Calibrate it to a specific operator's category mix, service-level targets, and data maturity before using it in a board case.
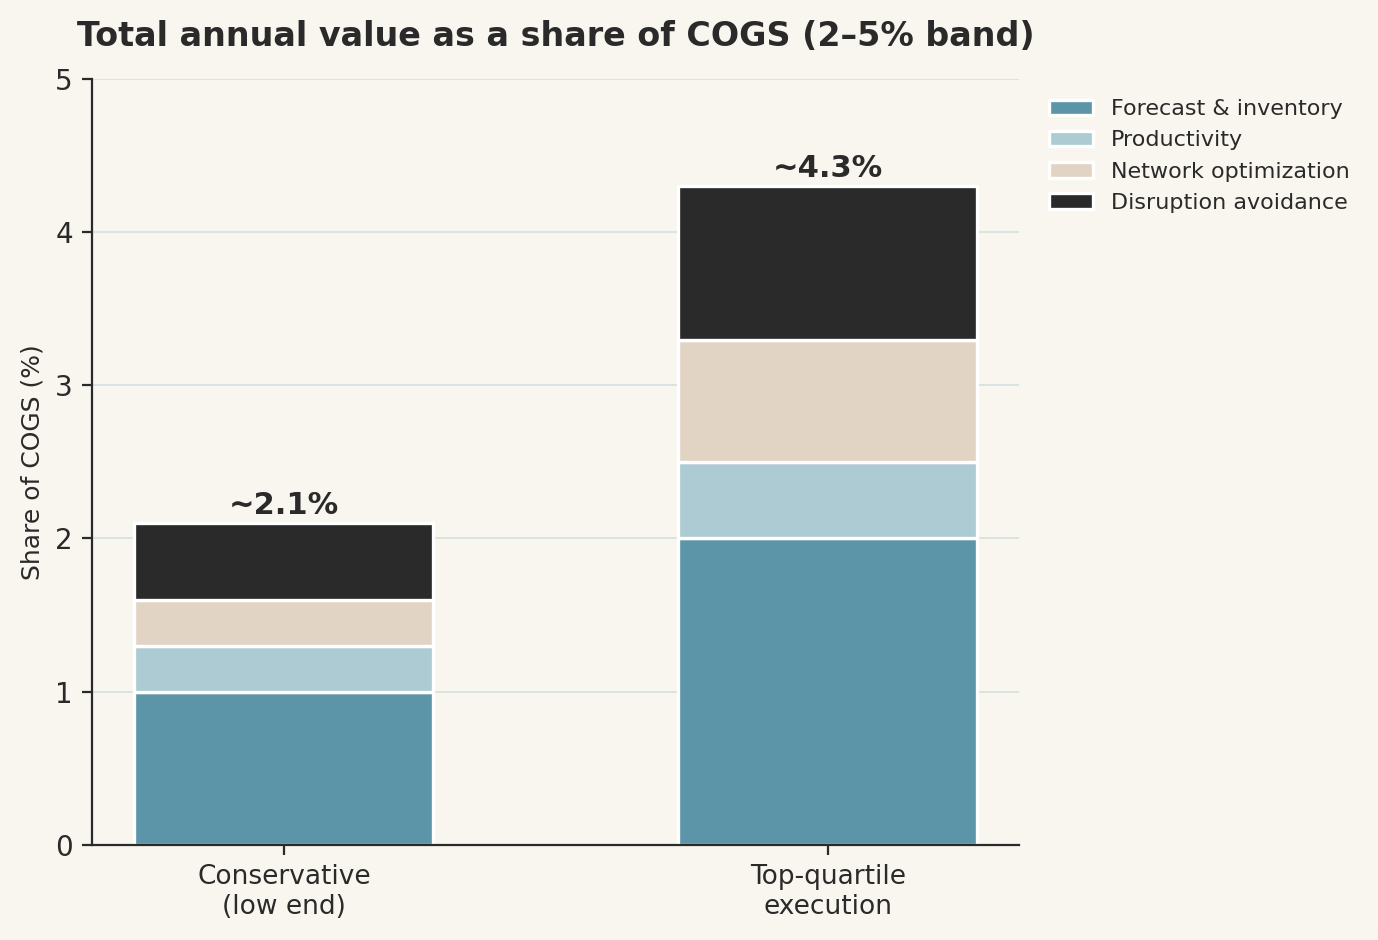
Two of these levers deserve a closer look, because they are the ones most often mis-sized.
Why disruption avoidance belongs in the business case
Disruption avoidance is the value created by detecting and responding to supply shocks before they hit revenue or margin — and it is the lever most CFOs leave out of the model entirely. They leave it out because it is harder to attribute than an inventory reduction, not because it is small.
It is not small. McKinsey estimates that supply chain disruptions lasting a month or longer now occur every 3.7 years on average, and can cost a company up to 45% of a single year's profit over the course of a decade (McKinsey, Risk, resilience, and rebalancing in global value chains). Cycle-averaged across that cadence, even partial avoidance — earlier signal, faster reroute, pre-positioned buffer stock on the SKUs that matter — translates into a $30–60 million annual contribution for an operator of this size.
“Predictive tools tell you what's coming. Agents decide what to do about it.”
That distinction is the whole point of the disruption lever: the value comes not from a better forecast of the shock, but from a faster, automated response to it.
Why the productivity lever is the easiest to overstate
Planner and analyst productivity is the value released when AI removes manual data wrangling and exception triage from skilled planners — and it is genuine, but it is also the lever most likely to be inflated in a vendor deck. The reason is that individual time savings rarely convert cleanly into team-level output.
Gartner found that generative AI productivity gains for individual desk workers did not translate to team-level gains, with time saved declining from 4.11 hours per individual worker per week to 1.5 hours per team member per week (Gartner, February 2025). That is why the productivity lever in the table is sized at a deliberately modest $15–30 million — real, but not the headline. There is also a talent ceiling to respect: 90% of supply chain leaders told McKinsey their organizations lack sufficient talent and skills to meet their digitization goals, and roughly 43% of supply chain working hours are technically transformable by generative AI. The productivity value is captured only when the operating model is redesigned around the tooling, not bolted onto the existing one.
Why the range is wide: structure decides the outcome
The 2–5% band is mostly explained by program structure, not by which model or platform a company buys. Programs that cluster at the top of the range share one trait: they are scoped around measurable operational outcomes, not seat-priced software licenses.
This is where most programs quietly fail. Gartner predicts that 60% of supply chain digital adoption efforts will fail to deliver their promised value by 2028 (Gartner, May 2025), and research from the MIT Center for Transportation & Logistics has found that fewer than 30% of supply chain AI pilots transition into production. The teams that beat those odds tend to look like Gartner's high performers, who deploy AI to optimize processes at more than twice the rate of their lower-performing peers (Gartner, February 2024).
At Heizen, we treat the business case as a sequencing problem before a software problem. The first question is never which platform — it is which decision needs to happen, in what window, with what authority, and against what baseline. Heizen is an AI-native software delivery company that builds supply chain systems for enterprise CPG and manufacturing companies, and in that work the same pattern shows up repeatedly: the operators who tie funding to a named decision and a measured baseline land near 5% of COGS; the ones who buy a platform and hope land near 2%, or fail to deliver entirely.
What this means for the board case
For the $10B operator, the practical takeaway is that the business case typically shows payback in 9–18 months and positive cumulative NPV within the first 24 months — but only when the program is scoped lever by lever, with a baseline attached to each. The number is defensible. What is not defensible is presenting the top of the range as the expected case, or omitting disruption avoidance because it is harder to attribute.
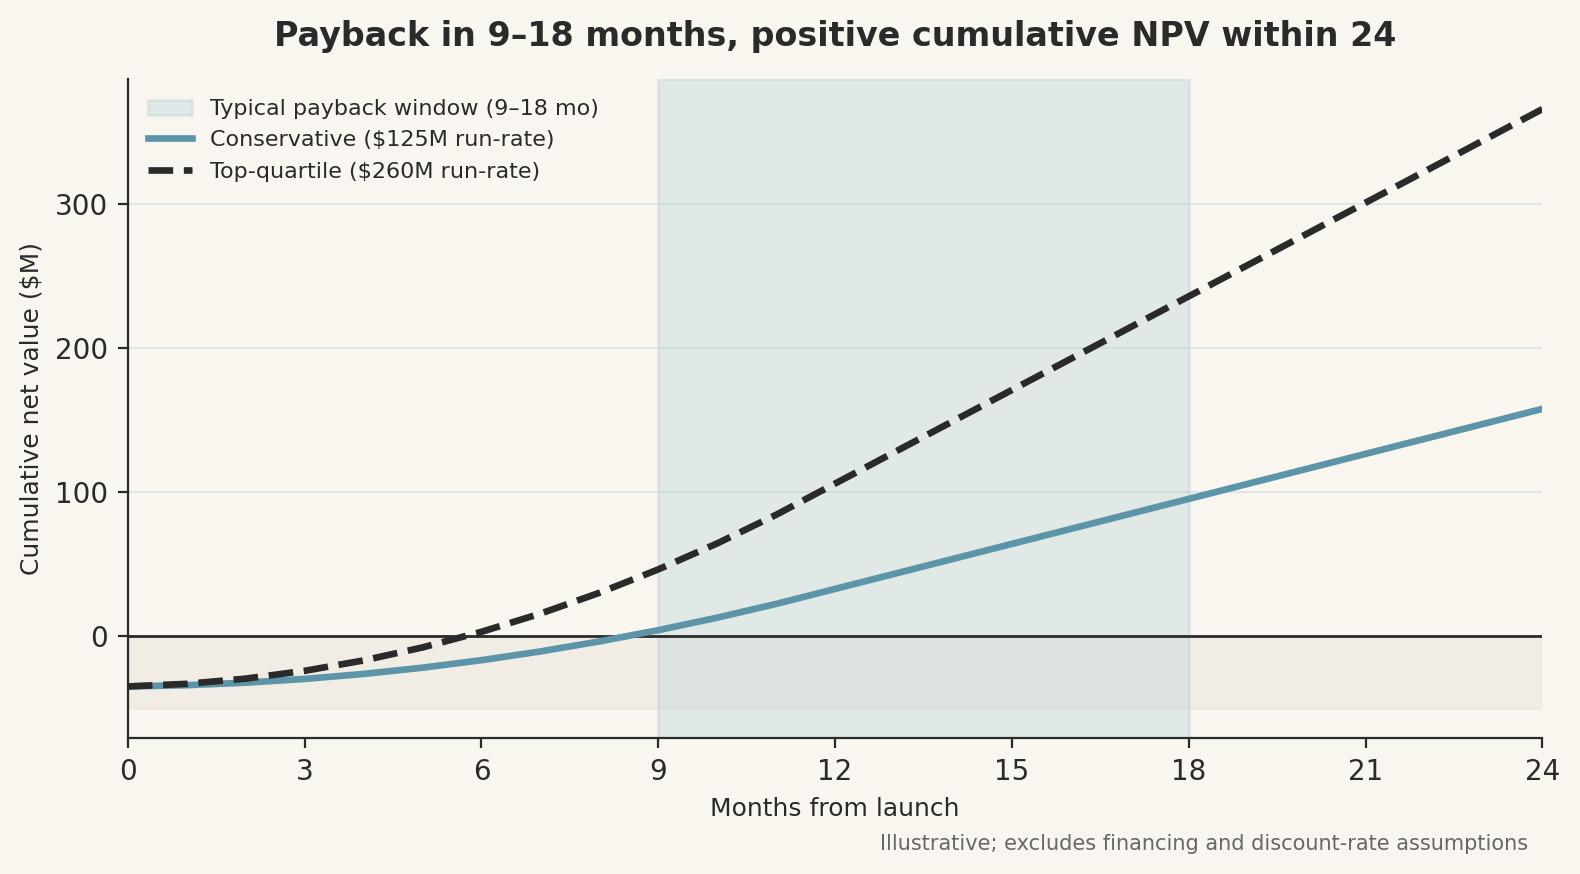
The cleaner way to take this model into a funding conversation is to size each of the four levers against your own COGS base, discount the productivity lever for the team-level conversion gap, and treat the 2–5% band as a function of execution discipline rather than a property of the technology. The operators capturing the high end are not buying better AI than everyone else. They are scoping it better.


